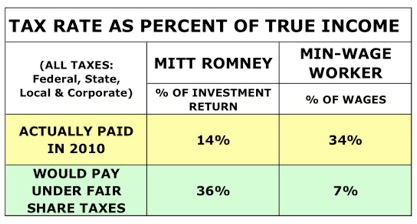
MITT ROMNEY'S REAL TAX RATE
ALL TAXES AS PERCENT OF ALL INVESTMENT RETURN & WAGES
MITT ROMNEY'S REAL TAX RATE
ALL TAXES AS PERCENT OF ALL INVESTMENT RETURN & WAGES


SEE THIS PAGE FOR TABLE NOTES
SEE A COPY OF MR. ROMNEY'S FEDERAL TAX RETURN
Since the Romneys paid no penalty despite their underpayment of estimated taxes for 2010, their 2009 income tax must have been under $1,245,000, less than half of what he paid for 2010. Assuming their investment return on their $200 million net-worth was only half that of the S&P500 for 2009, their federal tax rate was under 5% of their investment returns and income that year.
From the New York Times: "What Mr. Romney’s returns illustrated ... was the array of perfectly ordinary ways in which the United States tax code confers advantages on the rich, allowing Mr. Romney to amass wealth under rules very different from those faced by most Americans who take home a paycheck."
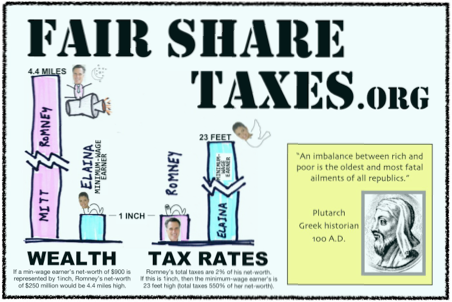
MITT - Two-time ELAINA - Minimum-wage
presidential candidate home health aide

THANKS TO THE HUNDREDS WHO HAVE CONTACTED ME ... FOR YOUR KIND COMMENTS AND YOUR HELP IN REFINING THE TAX PROPOSAL FOUND HERE.
COMMENTS ON THE FAIR SHARE TAX PROPOSAL:
- "Congratulations on this fantastic plan, beautifully conceived, and meticulously detailed."
- "I applaud you on your website, which is the best idea for US policy I have seen in my 73-year lifetime."
- "This should be the starting point of an overhaul of our draconian tax code."
- "Thanks for putting up the site and all of the information you have collected. I wish Congress and President
Obama would read it."
- "If I'd found your site first, I might not have bothered with [writing] my [tax reform] book.
- “Your essay is brilliant. Period." (see ten-page essay OR one-page summary)
DECIDED YOU WANT TO DO SOMETHING TO PROMOTE THE FAIR SHARE TAX PLAN?
Then E-mail the following paragraph to all the contacts in you e-mail address book who may be interested. Then post the paragraph to your Facebook wall:

Go to the Spread the Word page to see many things, big and small, you can do to help promote the Fair Share Tax Plan. Otherwise, keep reading to learn more: Website Summary
Email questions, comments to: FairShareTaxes@att.net
Friend me and the website on Facebook: FairShareTaxes
Quote of the month: “It is not very unreasonable that the rich should contribute to the public expense,
not only in proportion to their revenue, but something more than in that proportion.”
- Written by Adam Smith in "The Wealth of Nations" in 1776, the year the United States was founded. He is
considered the father of economics and one of the first advocates of capitalism.
Link of the Year: The Failed GOP Stimulus, which has been 30 years of tax breaks for the rich, cost many times more than President Obama's successful stimulus
Site established: October 2010
Site last updated: June 25, 2017
Page views since October 2010: 934,402 (72 views/day and growing!)
Site safety: All down-loadable documents on this site have been virus-scanned on a Mac. Any submitted
names, addresses, email addresses, etc. are never passed to any third party .. ever
To advertisers: I do not accept advertisements (to eliminate the appearance of bias and give my readers at
least one ad-free site in their lives)
Written text at this site is copyrighted - All rights reserved

CRITICAL PAGES: HOME SUMMARY IMAGINE! HELP US SPREAD THE WORD!.


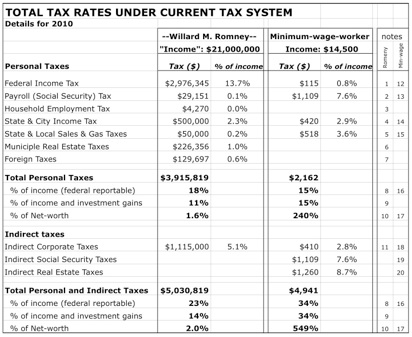
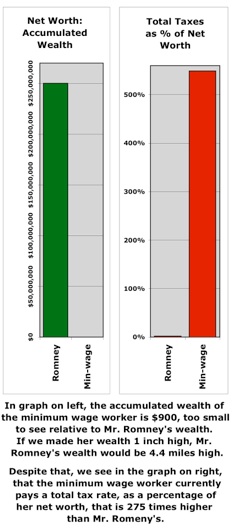


QUIZ: We know Mr. Romney has accumulated a net worth of about $250,000,000. If a minimum-wage worker has saved $900, using the total tax figures above, how much higher is the worker’s tax rate, as a percentage of net-worth, than Mr. Romney’s?
ANSWER: 275 times higher. Her total taxes are 549% of her net worth. His total taxes are 2% of his net worth.
FAIR SHARE TAX REFORM: A comprehensive tax reform plan for federal, state and local governments, that reduces total taxes on the working-poor and middle-class by thousands each year, encourages stable economic growth, vastly simplifies our tax laws, and slashes the national debt.
SEE FULL NAVIGATION MENU BENEATH PHOTOS AT TOP OF PAGE
CRITICAL PAGES: HOME SUMMARY IMAGINE! HELP US SPREAD THE WORD!.
COPYRIGHT - FAIR SHARE TAXES - ALL RIGHTS RESERVED
CONTACT ME: fairsharetaxes@att.net